Defining Product Metrics
Imagine you’re launching a new product or an important new feature and you need to define the metrics to track. How do you determine what to track? These metrics will be important as you consider how you’ll communicate product success, monitor product health, and to anchor your post-launch optimization and experimentation activities. So where to begin?
Start With the Goal
Before doing anything else, make sure you’re clear on the goal of the product/feature. Why was it built and what did you want to accomplish? This is really important because it centers your measurement around your strategy rather than it becoming an unfocused tactical exercise to measure random things.
Once you have a goal in mind, think about how you might measure the success of that goal and that will literally become the metric for your goal. For example, if your goal is to become the first thing users check every morning, then Daily Active Users (DAU) might be a good metric for measuring progress toward your goal.
Create a Pyramid
You’re likely to have a number of goals that you want to achieve but if you look closely at them – it is likely it is likely that some are higher-level goals and others are contributive to a higher-level goal. It can be very helpful to think in terms of a metric/goals pyramid with three layers, and determine your primary, secondary, and tertiary metrics, in which tertiary metrics contribute and support secondary, and secondary contributes to achievement of the primary metric.
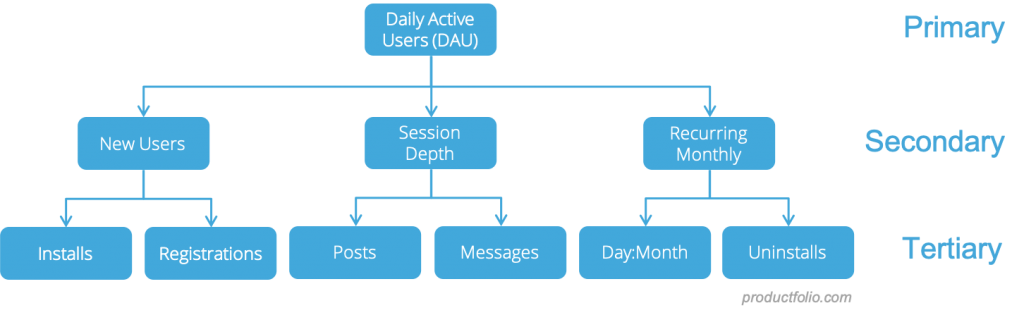
Going back to our example above, we said that DAU may be a good metric for our primary goal – it speaks directly to the stated goal. You’ll also want to look at how many new users are entering the app, how many are recurring after some period of time (let’s say a month), and just how active each session is. Each of these measures is important but ultimately look at a different dimension that contributes to building the overall active users count.
Under each of those secondary metrics are other, more precise tertiary metrics that once again, breaks down the story being told at the level above. Taken fun aggregate, you now have a full diagnostic view of your app that starts with a single metric, from which you can tell if there is a problem or if something is going well. From that high-level view, you can start digging in to diagnostic as needed. The primary “Northstar” metric is what you want to look at daily and what you might communicate upward to executive leadership teams. The deeper metrics are what you and your team will be working on every day, to drive those upper metrics in the right direction. And collectively, all of these metrics are what you’ll want on your product analytics dashboard so they’re at your fingertips when you need them.
Identifying Metrics To Track
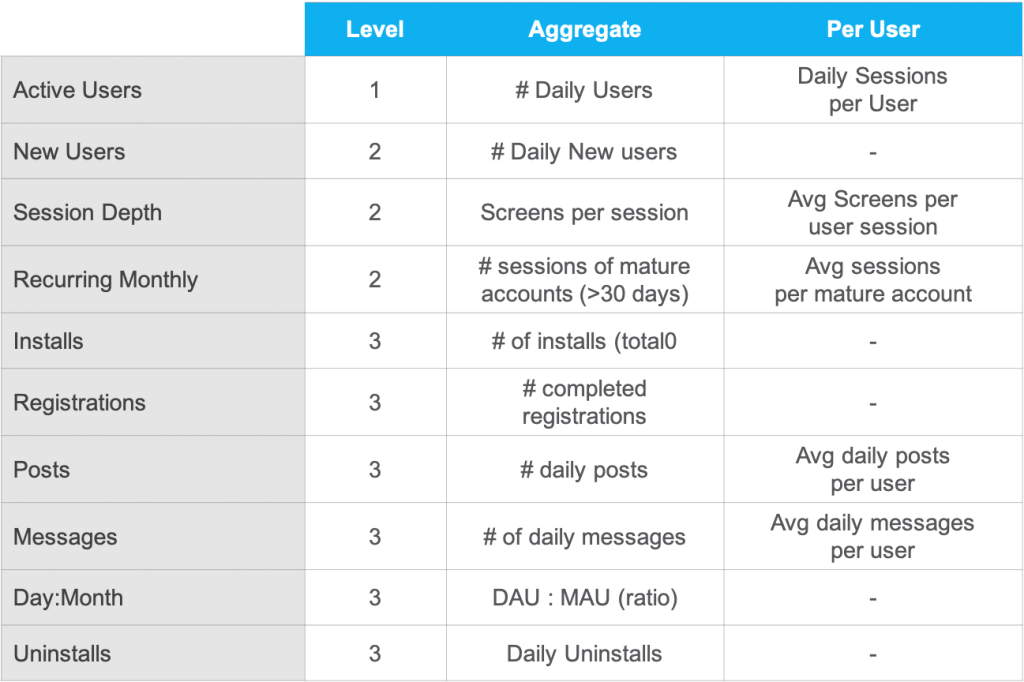
As you’ve identified the goals and placed them into a pyramid, its time to think through the actual metrics that will be used to measure the achievement of these goals. This can be a relatively straight-forward process if you think about there really just being 3 dimensions to every good metric:
- Event (behavioral action for which an event was emitted)
- Time (daily, weekly, monthly)
- Scope (aggregate or per user)
With these in mind, we may determine for our app that our time scope should be daily since we want to make this something our customers indeed use daily. Retention metrics would thus be viewed on a monthly basis as a point of comparison to see how they’re still engagement after 30 days. With that said, we just need to identify the events that we can use to measure the above goals. For the most part these are likely to be directly measurable based on our behavioral analytics data, though we can also use proxy metrics when needed, to “infer” the health of that goal. And so really we can create a matrix for each of our goals and start to map our the metrics for each of these goals.
<
Types of Metrics
There are a few good frameworks that spell out the key focus areas that you’ll want to think through your metrics. For example, 500 Startups gave us the AARRR Pirate Metrics funnel, Google Ventures gave us the HEART framework, and there’s also the GAME framework which is quite useful. At a summary level though, there are essentially a few key areas to keep in mind, and they generally track the user funnel:
- Acquisition – primary the domain of Marketing as it relates to ROAS and channel acquisition activities
- Activation – Signup and conversion activities. Are users signing up and becoming active at a healthy rte?
- Engagement – Core product metrics. This looks at how and how often the app is being used
- Retention – Primarily a lagging indicator of successful engagement and that users are finding value relative to cost
- Monetization – How revenue is being generated from your app (ads, sales, subscriptions, etc)
Conclusion
There you have it – a complete slate of metrics and goals to support your launching new product. There are a lot of interesting things you can do with your analytics dashboards once you have this foundation in place, such as visualizing key funnels and user pathways. Once your product is established and has a regular traffic pattern, you can also set alerts for when key metrics fall below a certain amount compared to expected levels. And by diving deeper into your own data and compared to other industry benchmarks, you should also start to get a sense for where A/B test driven optimization opportunities are as well. It all begins with a well-defined set of goals and metrics.
