What Are Key Product Metrics?
Product metrics give you an idea of how well your product or solution is doing. They provide useful insights into how users or customers interact with your product and what impact those interactions are having on your business. Successful product managers are able to work with data to extract key insights and make use of those to improve their products. The right metrics help in building a better product.
Why Are Product Metrics Important?
Teams can have different reasons for tracking and analyzing product metrics. Common reasons include understanding user behavior better, making the right changes to products, and influencing revenue. These metrics are also used to set the roadmap and enhance the product strategy, among other uses.
As a product manager, you must monitor certain key metrics to know the right actions to take. How do you know when something needs to change if you aren’t measuring anything? Start with the goal in mind – what are you trying to achieve and what are signs of a health product? For example:
- Understanding user behavior
- Assessing the impact of new features
- Gauging how successful launches are
- Is there friction in your signup or purchase funnel?
- Are users engaging and using the product regularly?
- What user activities can be associated with longer-term retention or higher purchases?
- Any unexpected dips in performance you need to know about?
Key Product Metrics
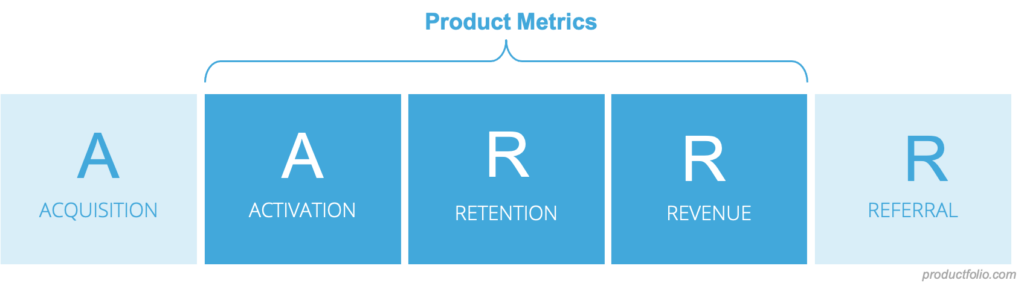
At the end of the day, a metric is just a measure of some events occurring over some period of time. The key is know the right things to actually measure (the key metrics). Ultimately this comes back to your goals. There are however a few standard frameworks that align to the most common business and product models, to give you a head start, such as the popular Pirate Metrics (“Aarrr!”)which outlines the 5 big goals of a business (Acquisition, Activation, Retention, Revenue, and Referral). We’ll use that framework to walk through what some of your key metrics might be:
Typically we’d start this conversation at the top of the funnel with Acquisition but that is more of a Marketing metric than product. Same with Referral that tis is often driven from outside of Product. Which really leaves the middle 3 goals for Product to focus on: Activation (registration and subscription), Retention (which includes engagement), and Revenue (aka monetization).
Activation
Activation is an essential first-step into the product. Activation events are usually one-time – for example, creating an account, app installs, or making the first booking using a ride-hailing app. The most common activation metric is Activation, and that can be expressed either as an aggregate count or as a rate – ex: New Activations or Activation Rate. This compares the number of activated users to the total acquired users as a ratio.
Engagement (aka Near-term Retention)
These metrics measure how successful you are at making customers interact with your solution, providing a hint of how satisfied they are. They help to track the regularity and rate of desired actions. Creating effective engagement behaviors is what ultimately sets up Retention and so that’s why we’re fitting it in here.
Common metrics in this category include:
- Conversion rate – This gives you an idea of the number of users that completed a desired action or conversion event. This event varies and could be anything from filling out a form to downloading content or purchasing a product. It is a ratio of conversions to total visitors.
- Average users – This metric measures the number of active users within a period or the frequency of user engagement with your product. You could assess daily active users (DAU), weekly active users (WAU), and/or monthly active users (MAU).
- Sessions per user – A measure of times a typical user spends using your product, app, or site. It is calculated by dividing total sessions in a period by total users.
- User actions per session – With this metric, you get to know what actions users take and the number of times they do so.
- Net Promoter Score (NPS) – Also considered a user satisfaction metric, NPS gives a hint of customer loyalty. It measures overall satisfaction or perception of a feature or product. It is usually calculated with the aid of a 0-10 scale and the classification of users into promoters, passives, and detractors.
Retention
This is a measure of how many users continue to use your product after the first experience. This is crucial for all types of products – perhaps, more especially so for Software-as-a-Service (SaaS) products. How many users continue to pay or remain active from a period to the next? If you’ve setup effective Engagement patterns already, that’s half the battle in retention. If a user is not engaging or using the product afterall, why would they come back, and thus how can you retain them?
- Retention Rate – the most basic metric for retention and you want it to be as high as possible. If it isn’t properly monitored, you may find that you aren’t getting the desired results despite bringing in more new customers. The calculation of the retention rate is quite simple. You simply divide the number of users that continue to use your solution by the total users you have initially.
- Churn rate – is the reverse of the retention rate. It is the percentage of users that stop using your product during a period.
Revenue (aka Monetization)
This is no doubt an ultimate goal of what a for-profit organization does – the ability to continue growing revenue. This is however more or less important, depending on the stage of growth of the product. For example, a new product trying to quickly grab market share may opt to forgoe maximum monetization in favor or faster growth early-on. This is an example of how goals ultimately drive the key metrics you choose.
Common monetization metrics include:
- Monthly recurring revenue/annual recurring revenue (MRR/ARR) – A measure of the total revenue that comes in monthly or annually
- Customer acquisition cost (CAC) – An average amount that is spent to acquire each new customer
- Customer lifetime value (CLV or LTV) – A measure of the amount an average customer spends during their entire relationship with an organization
Monetization helps businesses to grow MRR/ARR and to reduce CAC. An example of metrics that suggest how well a company is doing in terms of monetization is the percentage of paying customers that pay for upgrades. Another is the ratio of LTV to CAC.
Selecting the Right Metrics
When determining what metrics to track, some product managers choose the same ones that their counterparts in the same industry monitor. This is not bad but may not be the best solution. Metrics should ideally be tailored to the needs of individual organizations. Adopting an input-output approach may be more appropriate when you are trying to decide the best metrics to track. This calls for making a distinction between input and output metrics.
You can think of an output metric as your most important metric, what some people would call the North Star metric. The input metrics are all other measures that support the principal one. Typically, input metrics are more SMART – specific, measurable, actionable, relevant, and time-bound.
For example, Revenue is an output metric. It is not something you work on to directly influence other metrics. You instead use other supporting metrics to figure out how best to improve it. Product managers will benefit from having a good strategy and access to a good analytics tool to make the most of metrics. These will guide them in ensuring that they are tracking only those gauges that are most important. They will also enable more effective A/B tests and segmentation, among other benefits.
