What is BCG Growth-Share Matrix?
The BCG Growth-Share Matrix was developed in 1970 by Bruce Henderson of the Boston Consulting Group. BCG developed the matrix to help companies determine how to best allocate their financial resources. The matrix looks at relative market share and market growth to determine where a company’s product is positioned in the market. It’s a two by two matrix that’s divided by an x (relative market share) and a y (market growth) axis creating four quadrants. Each of the four quadrants represents a position in the market. Henderson advocated for companies to have a well- balanced portfolio of products with different growth rates and different market shares. Henderson is quoted as saying, “To be successful, a company should have a portfolio of products with different growth rates and different market shares. The portfolio composition is a function of the balance between cash flows.”
What is Relative Market Share?
Market share looks at the percentage of the market that the company controls, which indicates the amount of cash a product is likely to generate.
For example, if a company commands 30% market share in a 100 million dollar market, then the company is generating 30 million in revenue. Relative references where your product stands in reference to your competitors’ product. If your product has 30 percent of the market and your competitor also has 30 percent you have a 1:1 relative market share. If you have 30 percent and your competitor has 60 percent than your market share is 1:2.
The goal is to have the majority market share. By dominating the market with a higher market share than your competitors, you can command favorable pricing and return on ad spend, which create a positive cycle, ensuring continued market dominance.
What is Market Growth?
Market growth refers to the percentage of the market that is currently expanding. It measures how attractive the market is for a new product. Ideally, Product Managers want to launch a product into a rapidly growing market to capture as much market share as possible while it’s expanding. The least attractive type of market to introduce a new product to is a low growth market. Typically, a low growth market is already saturated and you will now have to fight with existing competition for a piece of the market that they already own. As opposed to a rapidly expanding market which allows you to carve out your own niche of the market that’s not yet accounted for.
BCG Growth-Share Matrix in Detail
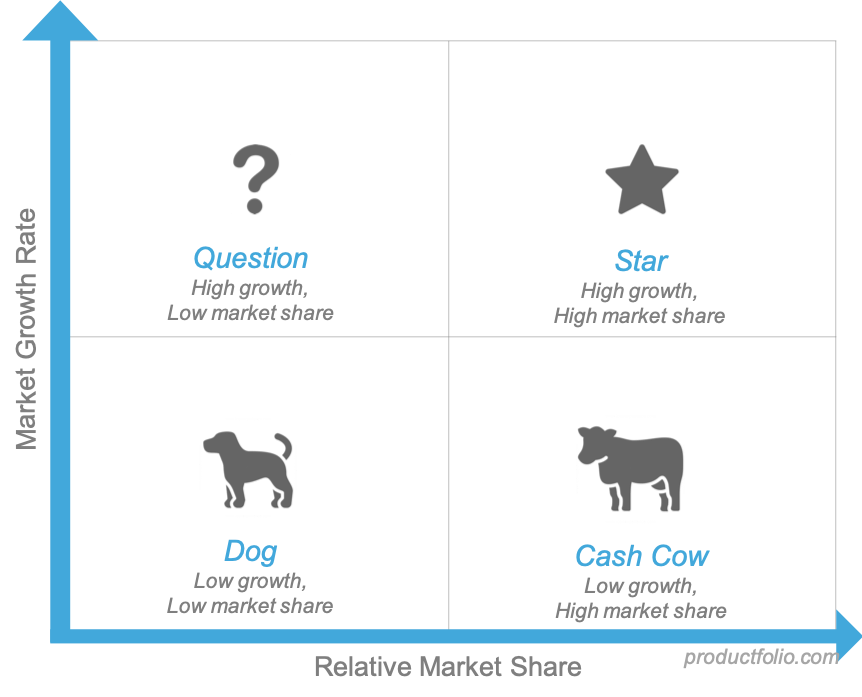
Every product will fall into one of the four quadrants. Once you’ve identified which quadrant best reflects your product you can then determine which action to take.
Stars – A star represents a product that has high market share with rapid industry growth. These products have the best market share and they generate the most cash. Stars are graduated question marks with the potential to become cash cows.
Stars require a lot of resources during the growth phase to fight off the competition. If the star can become an industry leader or create a niche during the market growth phase, they will become cash cows. Otherwise, they will become a dog when the industry slows based on low relative market share.
Cash Cows – A cash cow has a high market share in an industry with slow growth. Cash cows generate more revenue than they spend. Hence the term that you can “milk it for more than it’s worth”. Typically cash cows were previously stars. Cash cows require fewer resources since they are established (previously stars) and the market has slowed with less competition.
Dogs – Dogs are often referred to as “pets” and represent products that have low market share and low growth. Typically dogs spend as much as they make and break even. Investors want to see dogs sold off or discontinued.
Question Marks – Question marks represent products with high growth potential and low market share. They should be analyzed carefully to determine if they are likely to succeed. A successful question mark will become a star and then eventually a cash cow. If unsuccessful, they will become a dog.
Conclusion
Successful Product Managers will use a wide range of data and predictive analytics to determine which question marks to invest in and which dogs to divest before they consume resources unnecessarily. High growth markets always slow eventually, so it’s important to keep an eye on the stars and the question marks because they will always become either a cash cow or a dog over time. Using the BCG Growth-Share Matrix allows Product Managers to visualize where their product currently stands in the market and to analyze and predict the product’s potential for growth or failure.
