What is a Gantt Chart?
A Gantt chart is a form of bar chart – a horizontal bar chart – that shows the tasks and schedule of a project. It presents the plan for a project over time, including how to track and coordinate the associated tasks. The first of what we now know as the Gantt chart is said to have been created by Karol Adamiecki. The Polish engineer called it a Harmonogram and published the idea in Polish.
Why is it called a Gantt chart?
About a decade and a half after Adamiecki produced his project management chart, Henry Gantt created his own version. This new chart became more popular, especially in Western countries. As a result, the chart became associated with the American engineer. The Gantt chart has come a long way. Initially, people had to prepare them by hand on paper and there was a need for occasional redrawing. Things have now become a lot easier with a variety of software available to create the chart. The Hoover Dam is one of the iconic projects that this chart has been used in working on.
What Does a Gantt Chart Look Like?
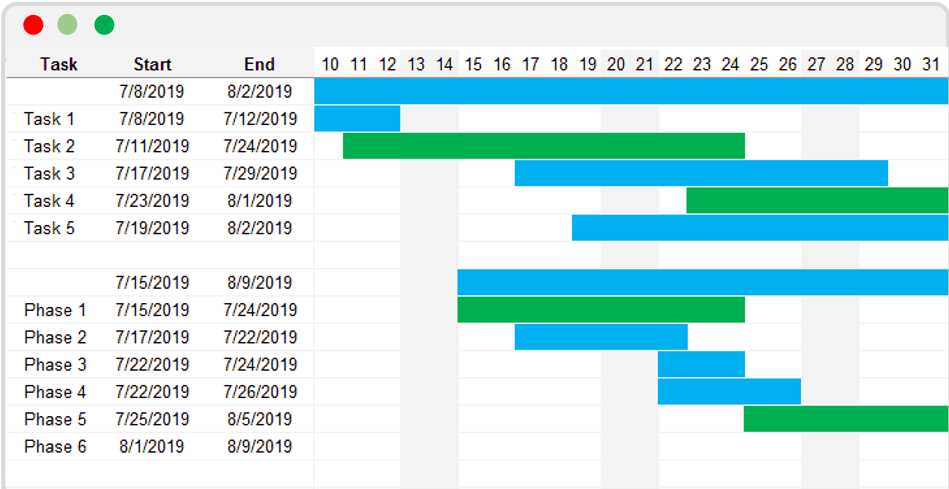
The Gantt chart comes in a variety of forms. Its left side typically has all activities relating to a project. Time scales for the completion of these activities may be added along the top. On the right side of the chart, horizontal bars are used to represent these activities. A quick look at a bar can tell you when an activity is starting and when it’s expected to end. Gantt Charts have several components. Aside from the list of activities or tasks and timelines, milestones, resources allocated, and progress are some other elements you may find on one.
How is a Gantt Chart Beneficial?
i. It helps you to visualize a project
With this tool, it becomes easier to get a good, detailed picture of a project. It doesn’t matter much whether you are working on a small or large project.
The chart makes it possible for you to see all tasks involved in a project from the beginning to the end. It lets you see what degree of progress is being made. As a product manager, you can not only use it to provide a high-level, strategic view but to also tell necessary tasks and resources.
ii. It facilitates effective communication
Another benefit of Gantt charts is that they can make it easier to explain projects to stakeholders. These people can clearly see milestones and how work is going toward achieving them.
With web-based tools now available for creating and sharing, it can be a lot easier to carry everyone along. Teams can quickly access the charts if there’s any confusion.
iii. It enables better management of resources
A Gantt chart may enable you to manage available resources better. Using it, you can simply identify idle resources or those that are currently under-utilized. Who’s busy and who is not doing anything? This information will let you know the appropriate actions to take.
iv. Not a Substitute for a Roadmap
The fact that a Gantt chart can enable product managers to provide a high-level view doesn’t make it an alternative to a roadmap. These charts relate strictly to projects and are specific to tasks, dates, and individuals to perform those tasks. A product roadmap is a higher-level planning document that looks across multiple projects, not just the details within a single project.
When to Use
Although its origin is traced to someone running a steelworks in Poland, the Gantt chart is more widely used today. It is now used in almost all industries where project management matters.
The chart is most popularly used for scheduling, tracking, and control of projects. It ranks among the most widely-used management tools.
Industries and teams that use Gantt charts these days include:
- Construction
- Manufacturing
- Software development
- Marketing
- Human resources
- Consulting
- Event planning
Gantt charts basically show you what you are to do in a project and when to do it. It is one of those tools that can help in promoting a common understanding of projects.
